
The brain. A brighter tomorrow.
Understand.Simulate.Repair.
Penfield builds technology to measure, understand,
model, simulate and repair the human brain.
Drag to rotate the brain, or use the arrow keys when the model is focused. Press Home or Escape to reset. On touch screens, swipe horizontally to rotate; vertical swipes scroll the page. Scroll-driven motion is disabled when reduced motion is preferred.
Brains are
hard to measure.
The organ we understand least is the one doing the understanding. Its anatomy is scattered across scans, formats and tools; measurements rarely reproduce cleanly; and much of what we can observe is never organised well enough to learn from. Understanding the brain begins with observing it precisely. That is where Penfield starts.
Built because
the tools didn’t exist.
Penfield began in Newcastle, Australia, with a frustration: the tools for observing the brain were fragmented, opaque and hard to trust. So we built our own: instruments that keep your data on your machine and are honest about where they fall short. Each one we ship teaches us what the next needs to do. That is the company in one line: build toward understanding, and say what is true about the result.
Fusion: software that organises and parcellates anatomy locally, flagging its own uncertainty.
Validation numbers published as they are, measured on public datasets rather than promised.
Observe first. Then model, simulate, and eventually help repair.
One company.
Six ways to understand
the brain.
The brain doesn’t work in isolation.
Neither should the tools we use to study it.
We’re building across the entire journey,
from the first measurement to what comes next.
Twelve products. One connected system.
Every Penfield product answers a different question about the same brain, from the instruments that record it to the software that plans an intervention. Each is being built to stand on its own, and to work together on a shared foundation.
Observe & Understand
Understand
Simulate
Working software,
not a promise.
Penfield Fusion is a real, running build. Everything below is the software itself, captured, not illustrated. It turns structural imaging into one measurable anatomy: segmented, registered, labelled, and ready to question.
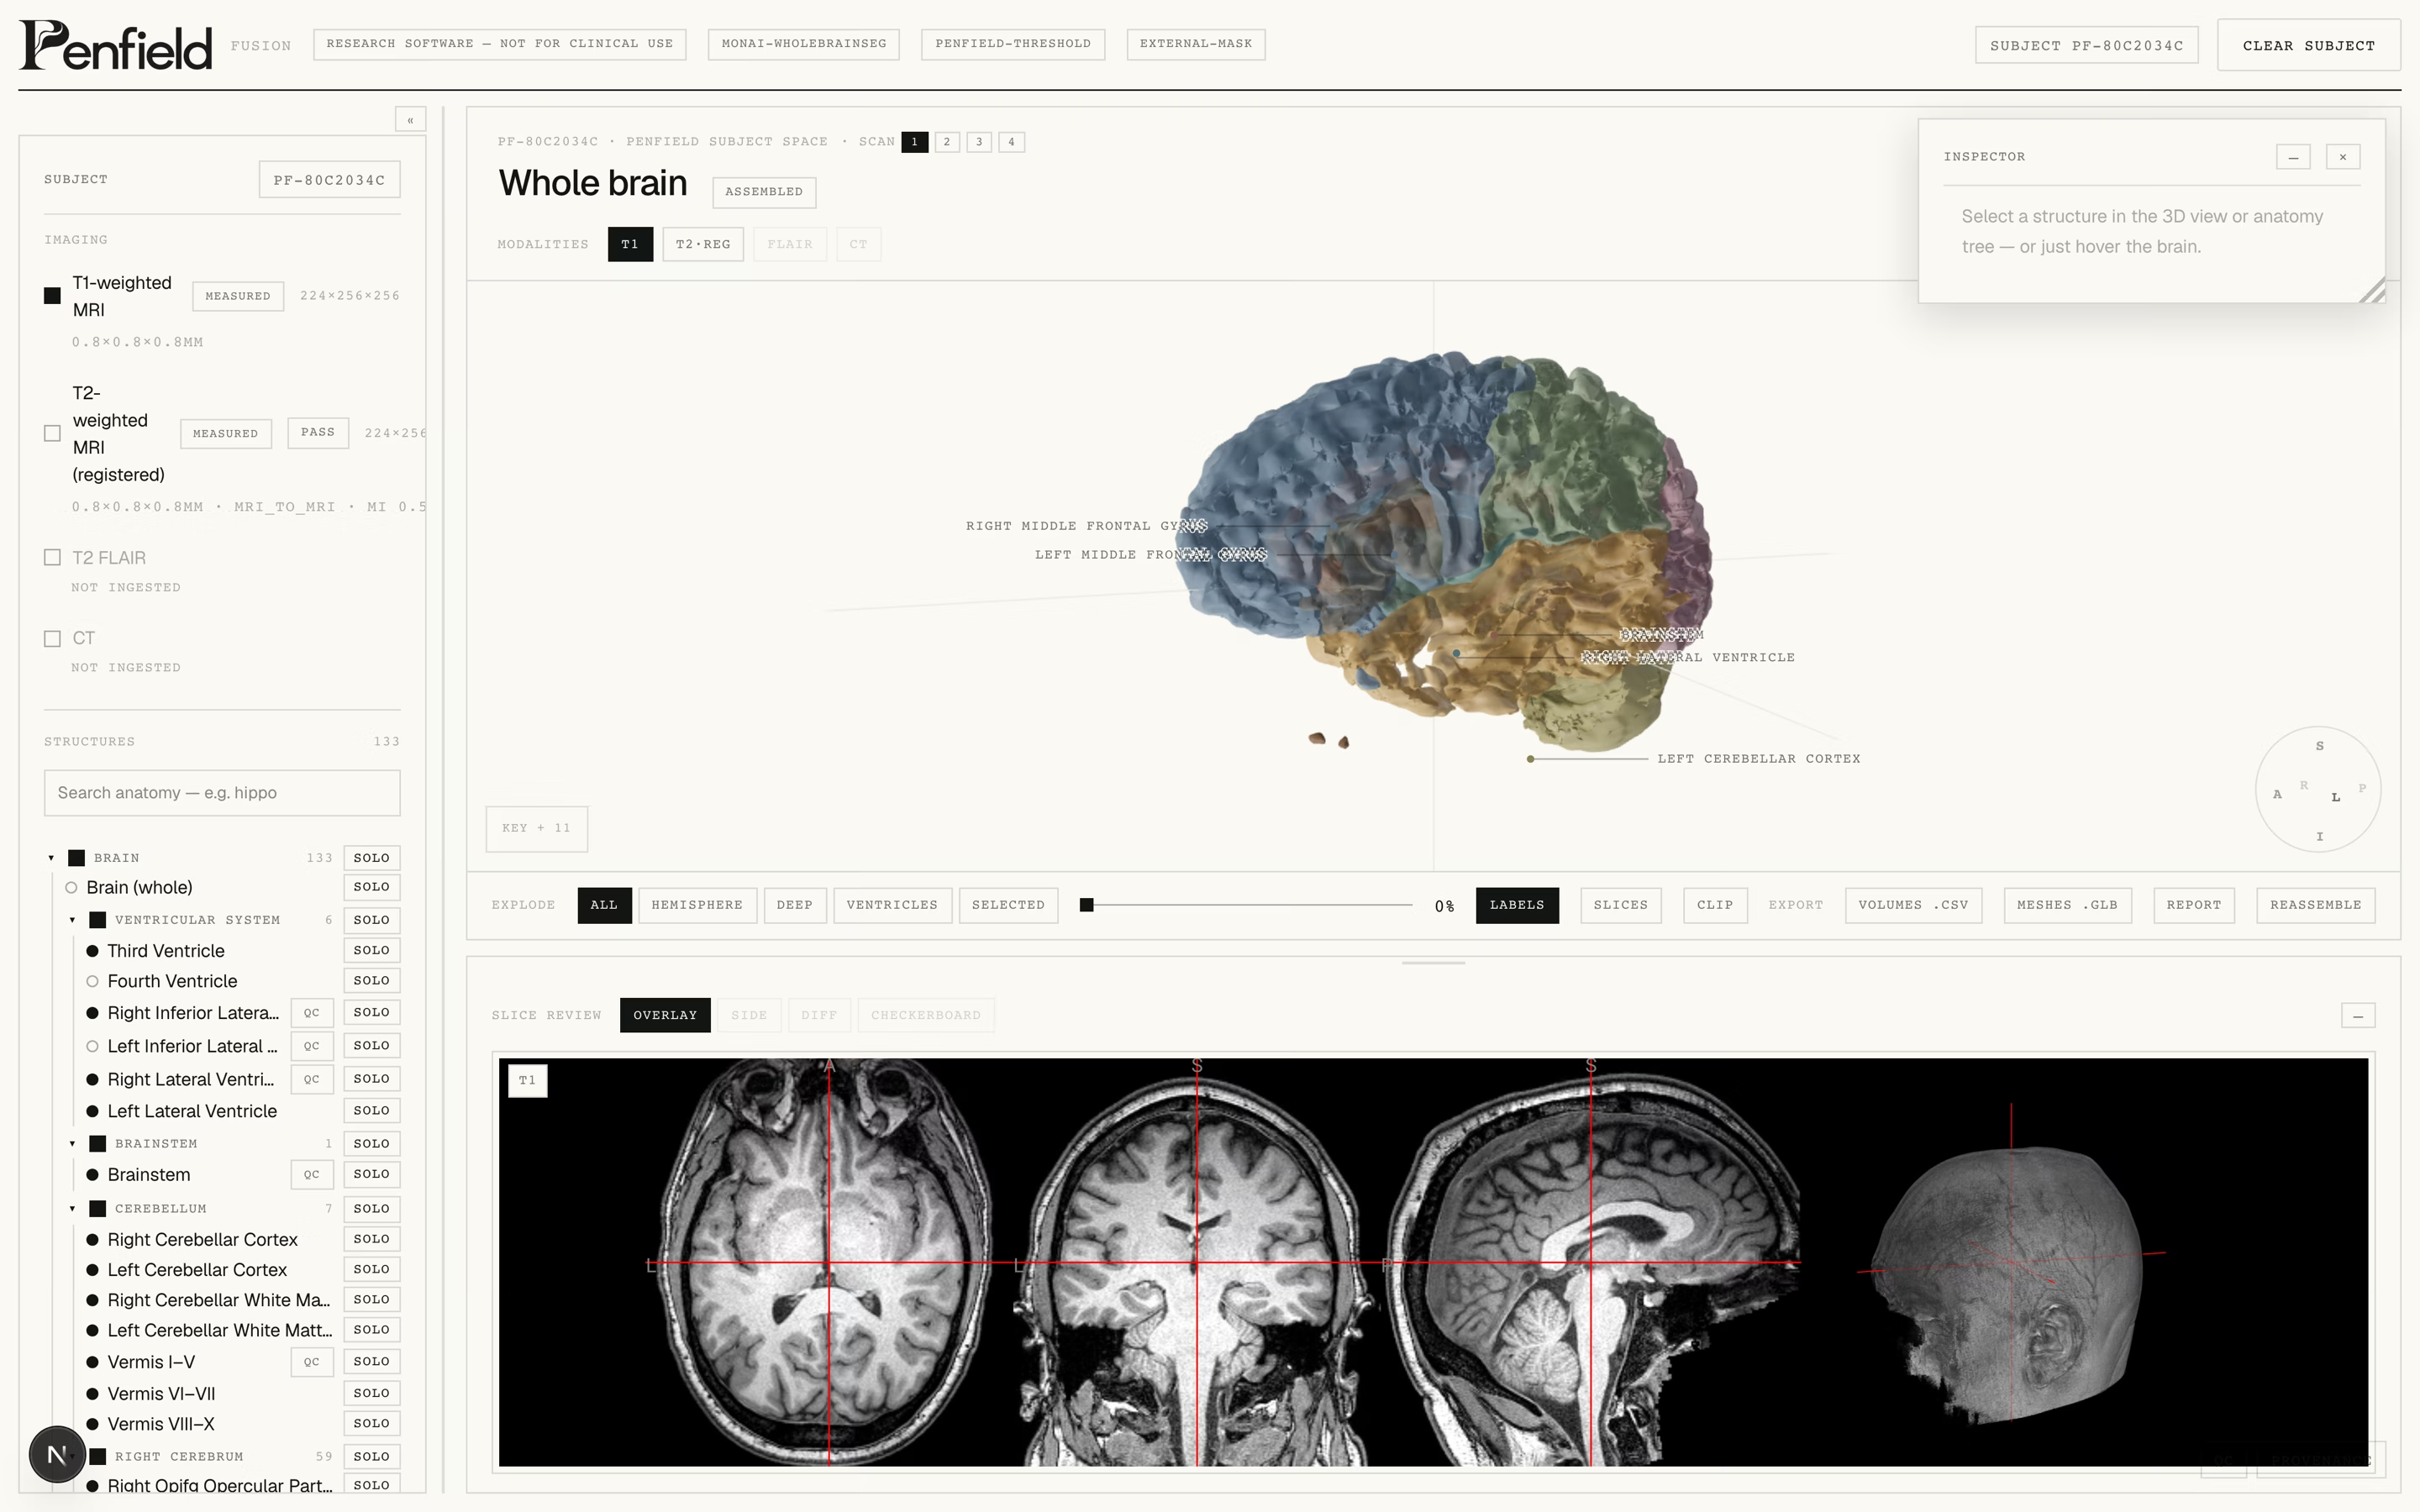
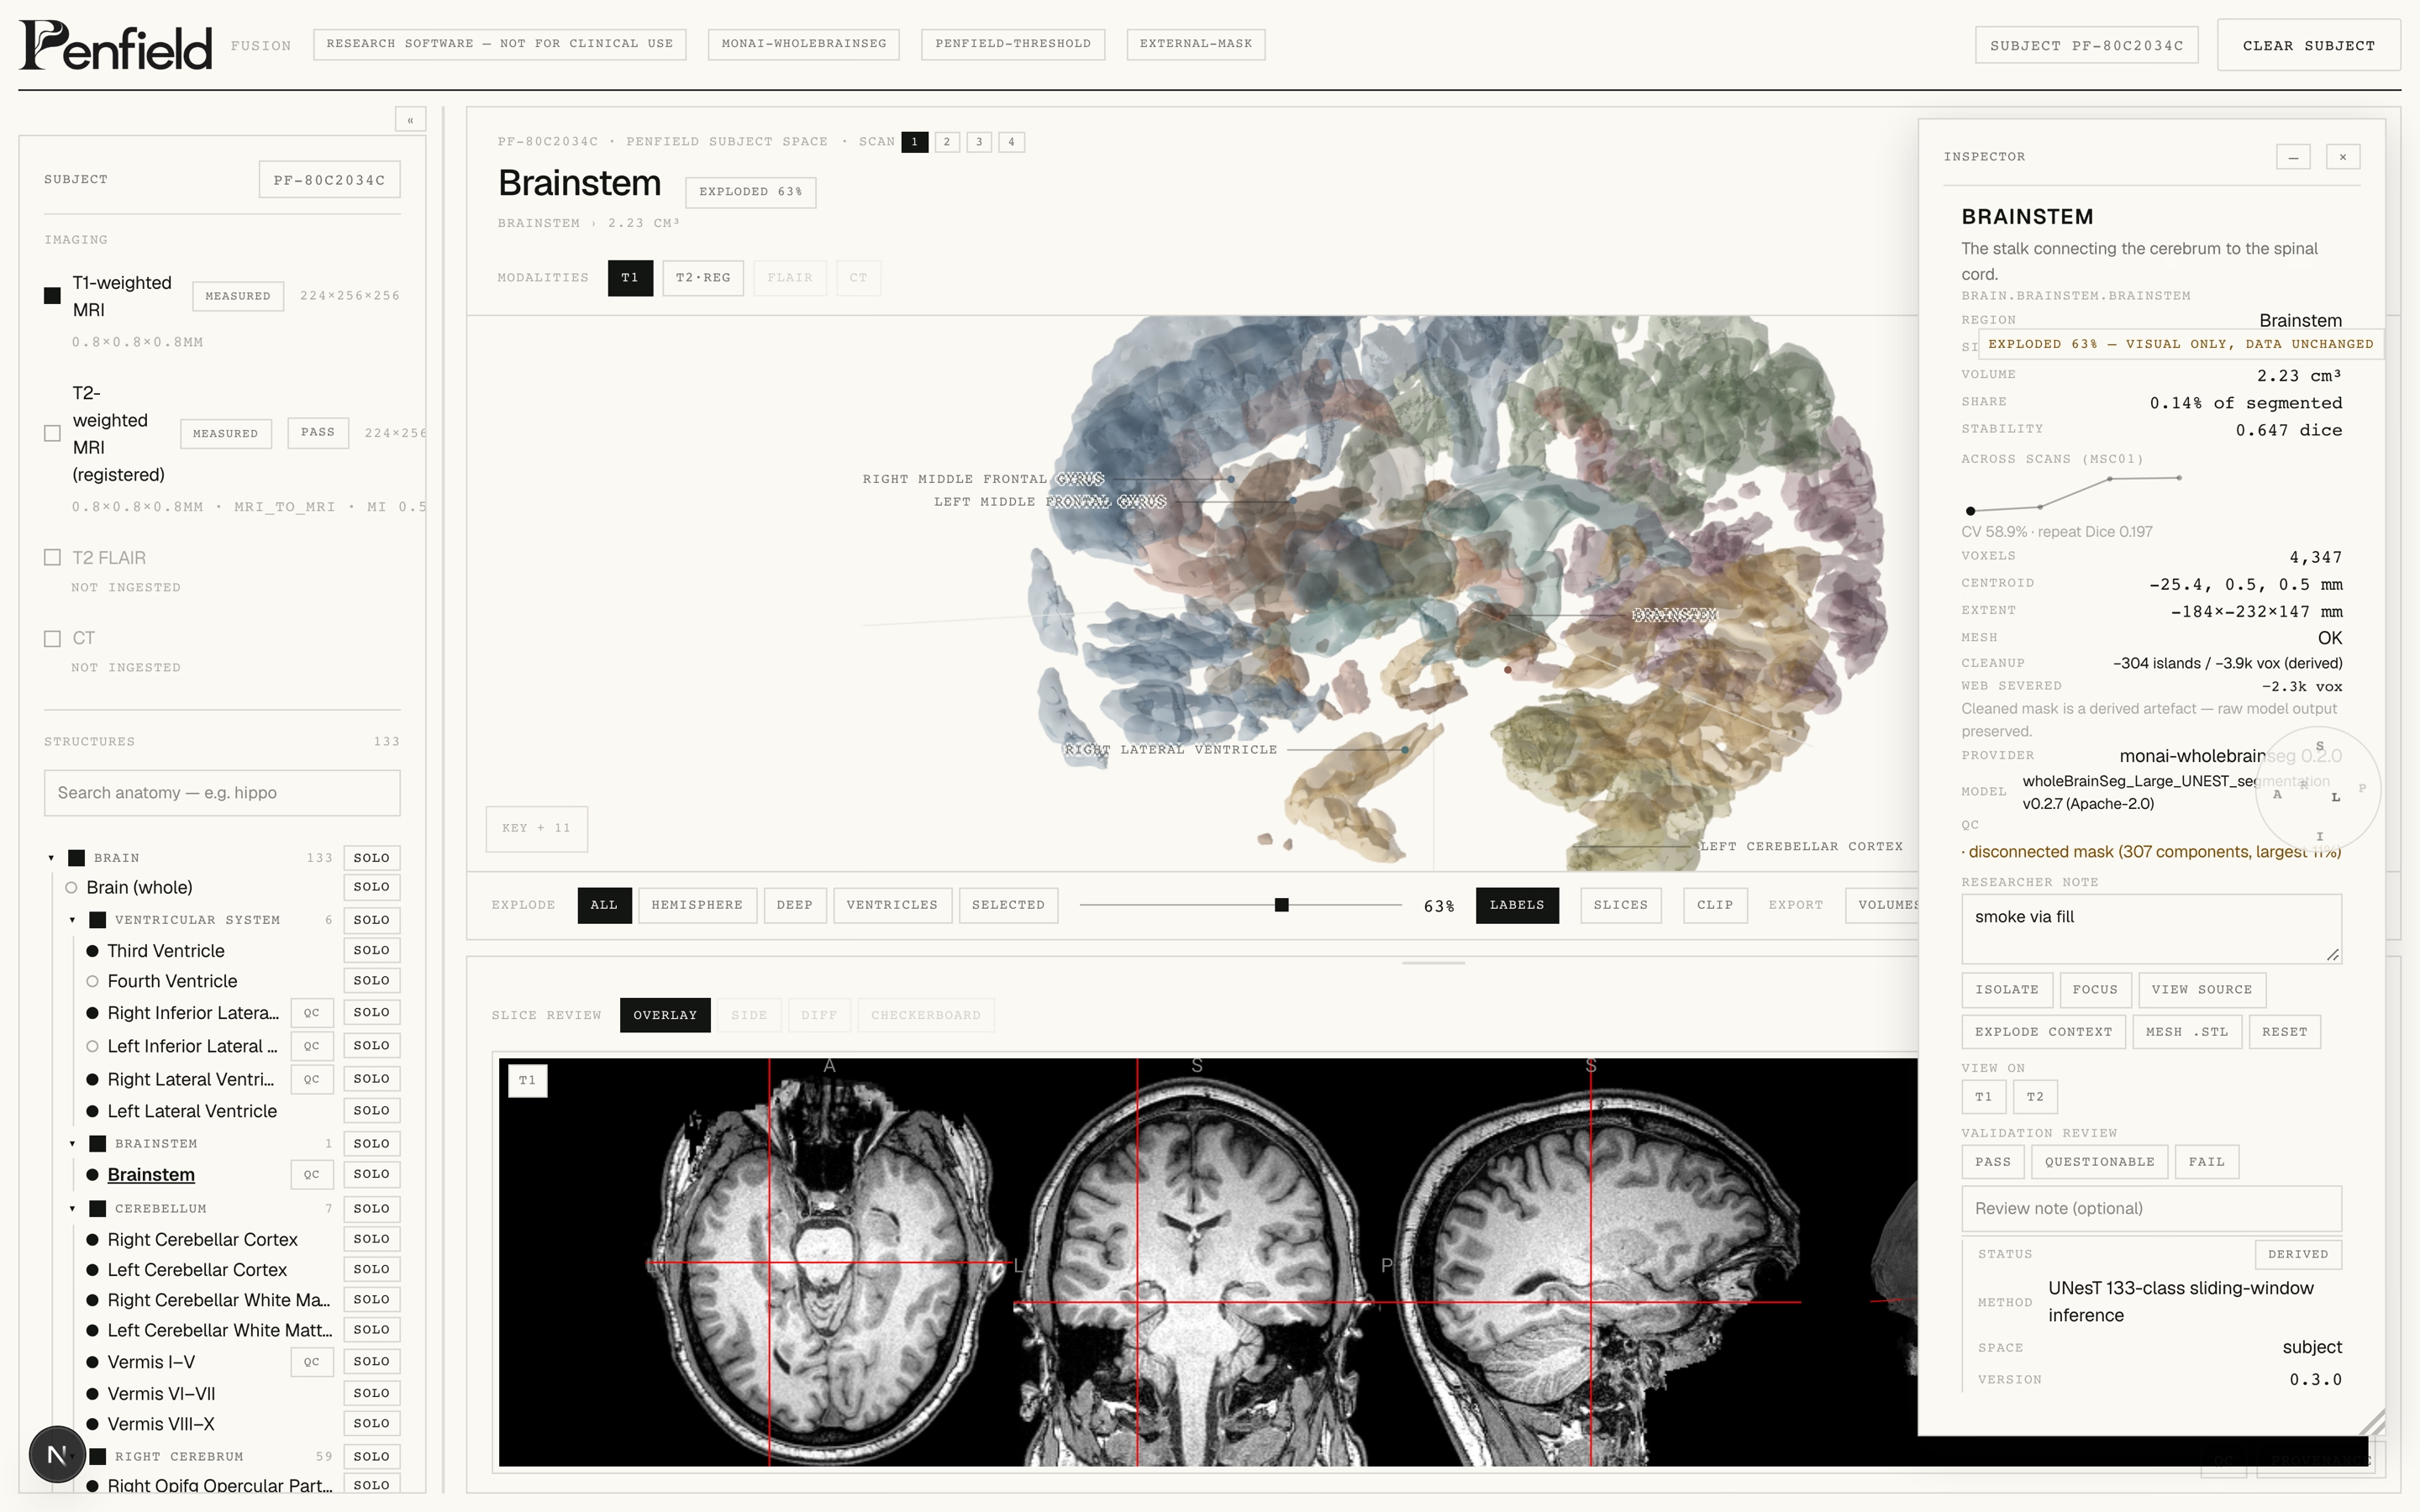
- 01133 structures, parcellated and measured per subject
- 02T1 / T2 / FLAIR / CT registered into one subject space
- 03Slice review with registration overlays
- 04Volume, stability and provenance per structure
- 05Exploded and isolated anatomy views
- 06CSV, mesh and report export: local files, your machine
Measured,
not claimed.
Penfield software is built for the way research actually works: private by default, reproducible by design, and honest about its limits.
- 01Local-firstScans never leave your machine. Processing, provenance and AI inference can run entirely on hardware you control.
- 02ReproducibleEvery pipeline is versioned, fingerprinted and cached: the same input always produces the same output.
- 03HonestUncertainty is flagged, not hidden. Structures that fail quality checks are marked rather than smoothed over.
- 04PublishedValidation numbers are measured against public datasets and reported as they are, including where they fall short.
- 133
- anatomical structures parcellated
- 0.64
- median Dice vs expert labels
- 0.91
- stability under perturbation
- 3×4
- subjects × repeat scans validated
Early validation on public datasets: OASIS-TRT-20-1 and Midnight Scan Club. Measured, not claimed.
In the open.
Automated parcellation vs expert manual labels on OASIS-TRT-20-1: median Dice 0.64, with the failure set flagged by independent QC signals.
Perturbation ensemble (noise, bias, smoothing) on a real subject: median 0.91; amygdala and hippocampi identified as least stable.
Midnight Scan Club validation: 3 subjects × 4 repeat scans, measuring volume, spatial and mesh repeatability.
Standing on
open data.
Every number on this page traces to a public dataset, a published model, or a run you can repeat. If it can't be checked, we don't print it.
- OASIS-TRT-20-1
Test–retest structural MRI with expert labels: the reference our accuracy runs measure against.
- Midnight Scan Club
Ten subjects, densely sampled. The repeatability benchmark behind our stability runs.
- MONAI wholeBrainSeg
The UNesT segmentation model family inside Fusion's parcellation pipeline (Apache-2.0).
- Desikan–Killiany
The cortical parcellation conventions behind our structure taxonomy.
Every discovery.
A better starting point.
Not six separate pursuits.
One continuous loop of progress.
Build a better way to see.
New measurement instruments open a window onto brain activity we could not observe before.
Observe. Model.
Simulate. Repair.
Observe
Precise imaging, anatomy and organisation: the foundation. Fusion is our first instrument.
NowModel
Normative atlases and whole-brain models built from what we observe.
In developmentSimulate
Computational models that test how neural systems respond to change.
In developmentRepair
Planning tools for intervention. The long horizon.
The horizonWhat we
don't know.
A research company is defined by what it admits. These are the questions we are actually working on.
- 01How much of the map is universal?
Every brain is the same shape and entirely its own. Where the population atlas ends, the individual begins. We are still finding the line.
- 02When is stable still wrong?
Repeatability can measure itself. A measurement can agree with itself a hundred times and still miss the truth. Ground truth is the hard part.
- 03How small is real?
Below a millimetre, anatomy becomes a judgement call. Which differences are biology, and which are the scanner, the pipeline, the day.
- 04From model to intervention.
The honest gap between simulating a brain and helping repair one. We name it the horizon because it is real, not because it is close.
Built in Newcastle.
Penfield is building advanced brain technology from Newcastle, Australia, connecting software, neuroscience, engineering and medical research.
Named for the man
who mapped the
living brain.
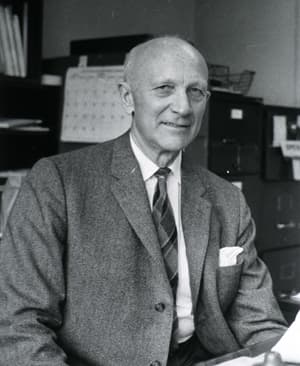
Wilder Penfield (1891–1976) founded the Montreal Neurological Institute and pioneered awake neurosurgery for epilepsy, stimulating the exposed cortex of patients who could speak, feel and remember through it, and charting what each region did. From those observations he drew the cortical homunculus: the first functional map of the human brain. We take his name as a standard: observe precisely, map honestly, and let the brain show what is true.
“The brain is the organ of destiny. It holds within its humming mechanism secrets that will determine the future of the human race.”
Seventy years
of looking closer.
- 1950sAwake mapping
Penfield stimulates the cortex of conscious patients and draws the cortical homunculus, the first functional map of the living brain.
- 1970s–80sSeeing without opening
CT and MRI make the living brain visible. Anatomy leaves the operating theatre and enters the scanner.
- 1990s–2000sFunction and wiring
fMRI and diffusion imaging join anatomy: what regions do, and how they connect.
- 2010sConnectomics
The Human Connectome Project and dense sampling chart pathways at a scale Penfield could only gesture at.
- NowPenfield
Observe, model, simulate, repair. The next chapter of a long lineage.
Signed,
Benjamin Miles.
Penfield is being built by Benjamin Joseph Miles in Newcastle, Australia: the software, the imaging pipeline, the validation runs, and this page. A deliberate effort to build the instruments properly, honestly, and in the open before asking anyone to believe in them.
He is thirteen. He goes to school during the day, and everything you are looking at (the code, the mathematics, the imaging pipeline) he taught himself by building it.
The reason isn’t abstract. His mum has blood cancer. He has watched what that does: the appointments, the waiting, the way a result can hold an entire household still, and he decided the skills he has are better spent on medical technology than on anything else.
He can’t sit in the consultation room and he can’t speed up a treatment. But he can build. So he is building the part he can build: the instruments that let people see illness earlier, understand it better, and fight it sooner. Penfield is the beginning of that: learn to observe the brain properly first, then everything else follows.
The hope is simple, and it isn’t small: that fewer people have to sit where he has sat and watch someone they love go through cancer. This is what a thirteen-year-old’s answer looks like: not a promise, but a start, made properly, one honest instrument at a time.
Asked and
answered.
What is Penfield?
A research software company building instruments and models for the human brain: to observe it, model it, simulate it, and eventually help repair it.
Is this a medical device?
No. Penfield builds research and development software. Nothing here is a diagnostic tool, and nothing on this page is a clinical claim.
Where does my data go?
Nowhere. Penfield Fusion is local-first. Imaging stays on your machine. No uploads, no analytics, no cloud dependency.
Who is it for?
Researchers, imaging scientists and neuro-engineers, anyone who needs honest, reproducible measurements of a brain.
Does it exist today?
Penfield Fusion is a working local build. The screenshots on this page are real. The other instruments are in development on the same foundations.
The long view
Understand the
human brain
completely.
Observe it. Understand it. Model it.
Simulate it. Repair it.